
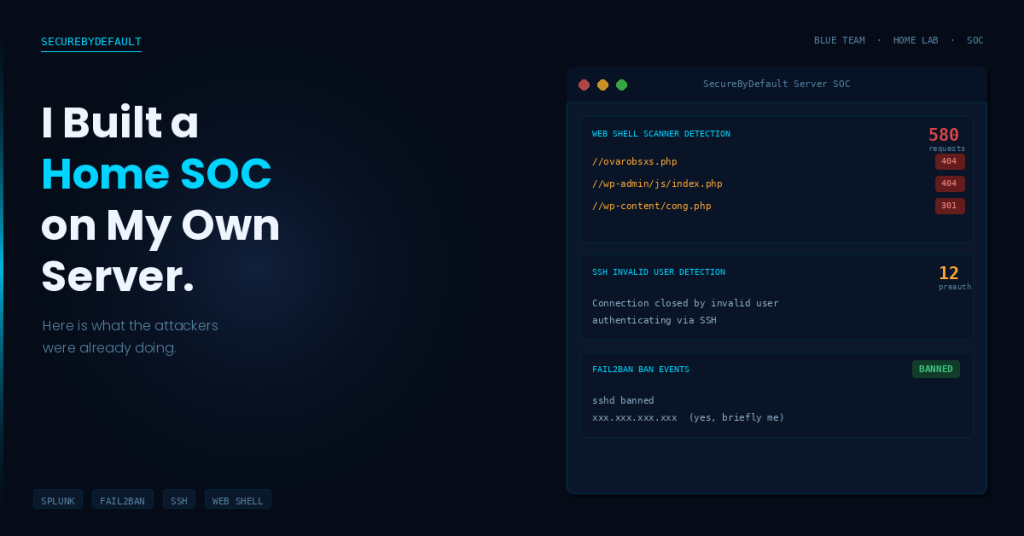
I have been wanting real security operations experience for a while now, not the kind you get from a course that hands you clean, pre-staged logs, but the kind where you are staring at your own infrastructure and something actually happens while you are watching. So I decided to stop simulating it and just build it.
The plan was simple enough on paper. Install Splunk Enterprise on my own production Linux server, the same Ubuntu box on Linode (now part of Akamai Cloud, where I used to work and still have a soft spot for) that hosts SecureByDefault, point it at a few real log sources, and build detections the way an enterprise SOC analyst would. Learn by doing, on infrastructure that actually matters to me, instead of a lab environment where the worst case is a snapshot rollback.
What I did not expect was how fast the “live fire” part of that plan would kick in. I was still wiring up log sources when I found out my server had already been getting probed for web shells. And a few days later, my own detection stack turned around and locked me out of my own server. Both of those turned out to be the most useful parts of the whole project.
What I Built
I installed Splunk Enterprise directly on the server rather than standing up a separate log collector, mostly because I wanted to keep the lab close to how a small business or solo engineer would actually run this: one box, doing double duty, no dedicated SIEM budget.
From there I wired up three log sources that actually matter for a small internet-facing server:
- /var/log/auth.log, which captures every SSH authentication attempt, successful or not
- /var/log/nginx/access.log, which captures every HTTP request hitting the web server
- /var/log/fail2ban.log, which captures every automated ban Fail2Ban issues
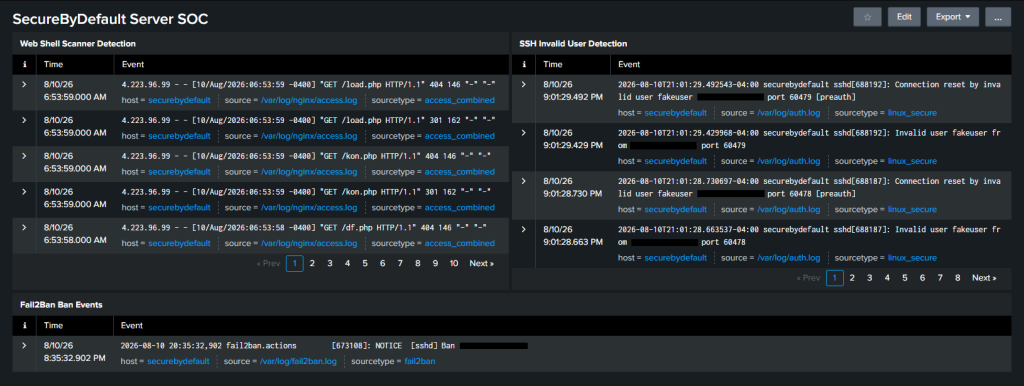
On top of those three sources, I built three detection searches and pulled them together into a single dashboard I named “SecureByDefault Server SOC.” Nothing fancy. Three panels, three questions answered: is someone probing my web server, is someone hammering SSH, and is my automated defense actually doing anything about it.
What I Found While I Was Still Setting It Up
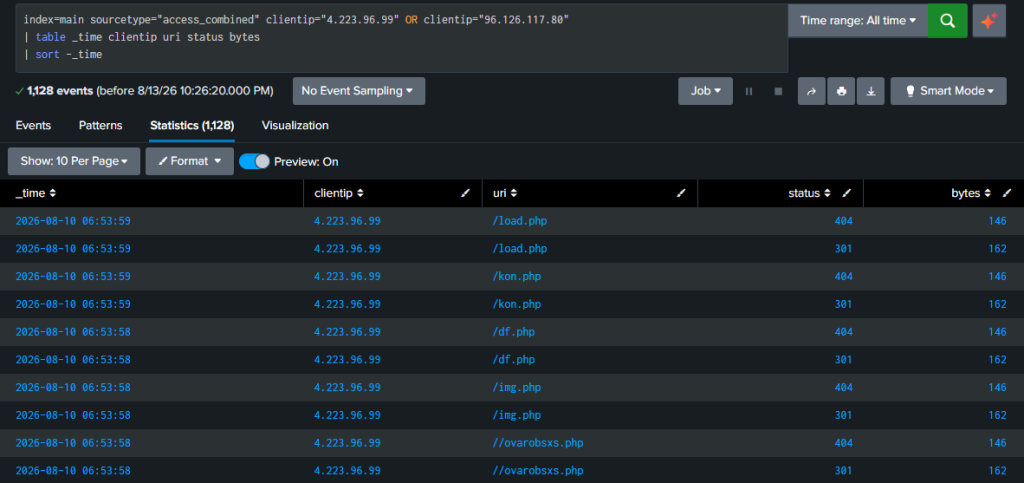
Here is the part that got my attention. I had not even finished configuring the dashboard when I ran a search across the Nginx logs just to sanity check that data was flowing correctly. It was flowing correctly. It was also showing me that a single IP address, 4.223.96.99, had already sent 580 HTTP GET requests to my server, all of it probing for PHP web shells.
The paths were not random guesses. A lot of them were randomized filenames, the kind of thing you would expect a previously compromised server to have sitting in a web root somewhere: //ovarobsxs.php, //xs5x46mb.php, //yaztn.php. Others were clearly aimed at WordPress installs specifically, things like //wp-admin/js/index.php and //wp-content/cong.php, even though this server has never run WordPress.
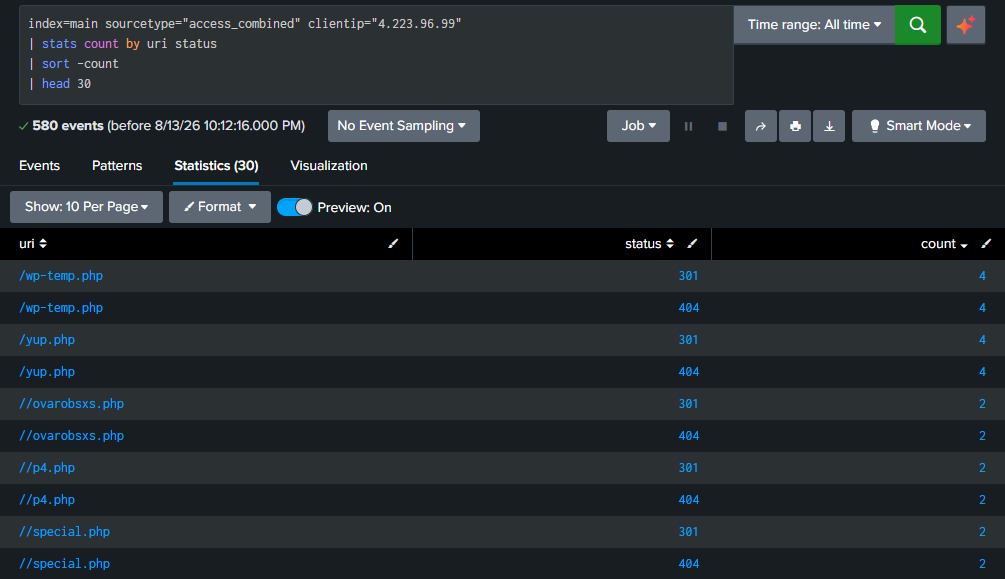
Every single one of those 580 requests came back with a 404 or a 301. The attacker found nothing, because there was nothing to find. But watching it happen in real time, request after request, filename after filename, made something click that no article about “attackers scan constantly” ever really landed for me before. This was not a hypothetical. This was one automated tool, methodically working through a list of paths, against a server that had barely been online.
The Part Where I Locked Myself Out
A few days later I moved on to testing the SSH detection side of things. The plan was straightforward: generate some failed login attempts using a fake username from my local machine, confirm they showed up in Splunk, and call that detection validated.
It validated a little harder than I intended.
Fail2Ban caught the pattern of failed logins exactly the way it is supposed to, decided the source IP looked like an attacker, and banned it. The problem was that the source IP was me. I was locked out of my own server, from my own home connection, by my own security tooling, doing exactly what I had configured it to do.
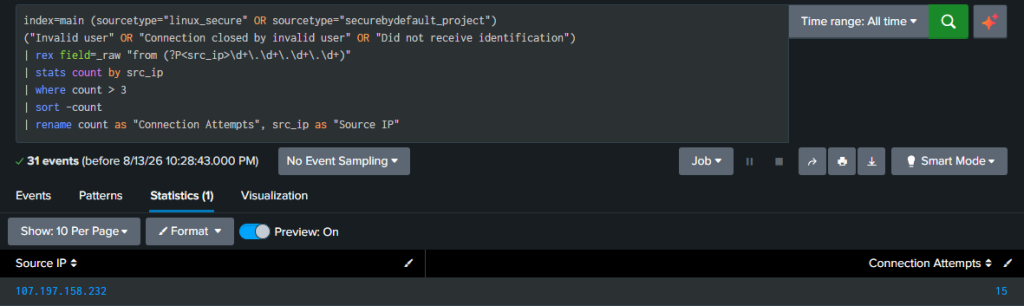
There is a specific kind of humbling that happens when you get outsmarted by a tool you configured yourself an hour earlier. I sat there for a second, laughed, and then went and pulled up Linode’s out-of-band Lish console, which gives you a direct terminal session into the server even when normal network access is blocked. From there I unbanned my own IP, and then did the thing I should have done before running the test in the first place: added my home IP to the Fail2Ban ignoreip whitelist so this would not happen again.
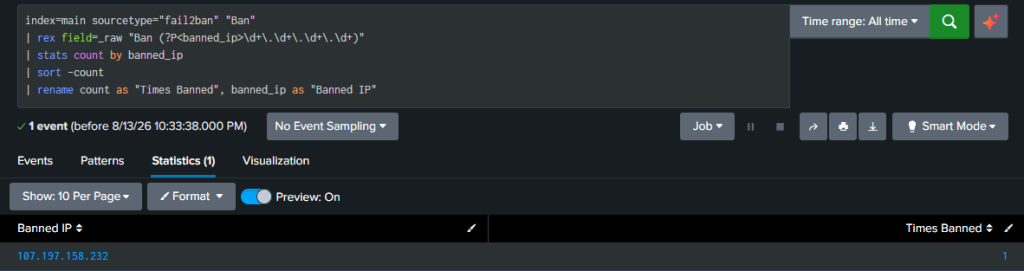
Nothing broke. Nothing was actually wrong. The system worked exactly as designed, and the only casualty was about ten minutes of my afternoon and a little bit of my ego. But it taught me something that no amount of reading about Fail2Ban ever would have: these tools are not abstract concepts on a slide, they have real, immediate consequences for real access, including your own.
What the Dashboard Actually Shows
The finished dashboard is deliberately simple. Three panels, each answering one question.
Web Shell Scanner Detection pulls raw Nginx log entries for requests matching known web shell probe patterns, the randomized PHP filenames and WordPress-style paths from earlier. This is the panel that would have told me about the 580 requests immediately if it had existed a day sooner.
SSH Invalid User Detection shows connection attempts that get rejected at the preauth stage, meaning the attacker never even gets far enough to try a password. It is a good early signal of automated SSH scanning before it becomes a real brute-force attempt.
Fail2Ban Ban Events shows the automated ban actions themselves, timestamped, so I can correlate a spike in failed logins with the moment Fail2Ban actually stepped in and did something about it. Including, apparently, the moment it stepped in and did something about me.
Key Takeaways
- You do not need enterprise infrastructure to build real SOC skills. One small server and a free tier of Splunk gets you closer to real detection engineering than most courses will.
- Automated scanners will find your server within hours of it going live. Not weeks. Not days. Hours. Assume you are being scanned from the moment your IP is reachable.
- Web shell scanners are not just checking for famous backdoor names. They are working through randomized filenames pulled from other compromised servers, which means the scan is broader and more methodical than most people assume.
- A properly hardened server deflects the vast majority of this silently. SSH key-only authentication, UFW, and Fail2Ban turned 580 probe attempts into 580 nothing-burgers. That is the whole point of hardening: not that attacks stop happening, but that they stop mattering.
- Getting locked out by your own detection system is one of the best learning experiences in security operations. It is annoying in the moment. It is also the fastest way to actually understand how these tools behave under real conditions instead of theoretical ones.
Where This Goes Next
This is going to be an ongoing series rather than a one-off project. I am planning to add more detections, more log sources, and eventually walk through a couple of the more interesting patterns showing up in the data in their own dedicated posts. If you are trying to break into SOC work or just want to see what a small, real, internet-facing server actually looks like under constant automated probing, this is going to be a useful thing to follow.
If you want to build something similar yourself, you genuinely do not need much. A small VPS, the free tier of Splunk, and the willingness to occasionally lock yourself out of your own server in the name of learning.
Get the security checklist most
businesses skip.
A free 25-point audit covering the exact gaps attackers hit first, written by an engineer in plain language. Plus one practical security breakdown every Tuesday.
Get the Free Checklist →Free on signup · Unsubscribe anytime · ~1 email per week