
If you’re preparing for a Linux support interview, you’ll probably spend a lot of time practicing commands. That’s useful. But many Linux troubleshooting interview questions are less about whether you remember a command and more about how you think.
Here’s a classic example:
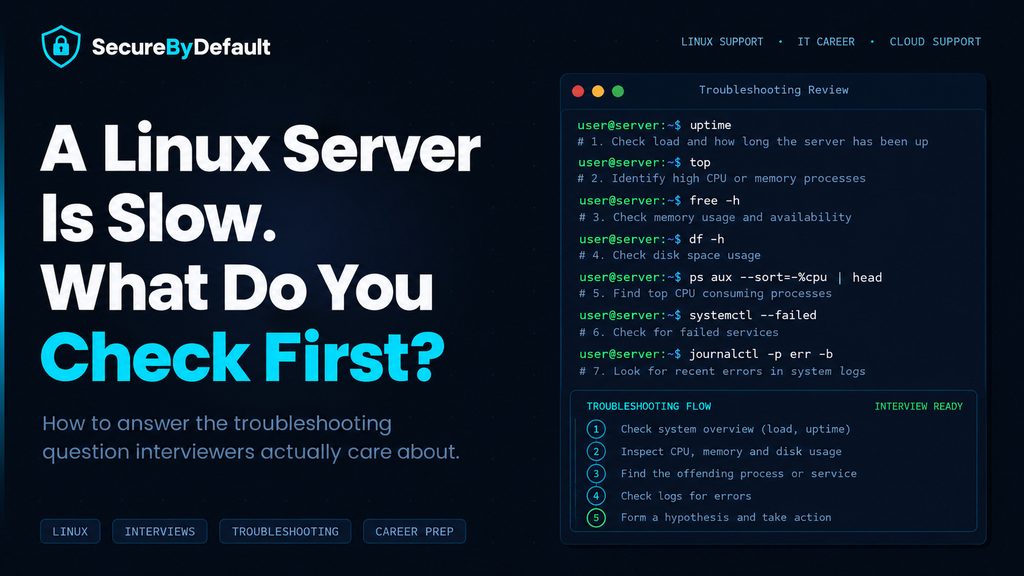
Questions like this can come up in interviews for Linux support, technical support, junior sysadmin, cloud support, and entry-level infrastructure roles. Every interviewer and company is different, so this isn’t a guaranteed question and there’s no single correct script. But the skill behind it, investigating a vague problem in a sensible order, is what a lot of support work looks like day to day.
This guide walks through a practical way to investigate, what each command tells you, why the order matters, and how to explain your thinking out loud.
What interviewers are usually evaluating
If you answer “top,” you’re not wrong. top shows load, CPU, memory, and the busiest processes in one view. It’s a reasonable place to look.
But a one-word answer leaves out most of what an interviewer might want to hear. In troubleshooting questions, many interviewers are paying attention to things like:
- Do you clarify the problem before diving in?
- Do you gather information before changing anything?
- Can you narrow down possible causes instead of guessing?
- Can you explain why you’re running each command?
- Do you know what to do if the first check doesn’t explain it?
You can know every command and still miss all of that. You can also forget a flag and do great, because your reasoning was clear.
Why the order of investigation matters
There’s a reason experienced people don’t just run commands at random.
Start broad, then go narrow. Cheap, wide checks (load, memory, disk) tell you which area deserves a closer look. Digging into one process before you know whether the problem is CPU, memory, disk, or the network is how you lose twenty minutes.
Look before you change anything. Restarting a service or rebooting can make a symptom disappear while erasing the evidence you needed. Read-only checks first, changes second.
Let each result change your next step. The best troubleshooting answers sound like a branching path, not a checklist: “If I see this, I’d do that.”
Here’s the sequence I’d suggest.
Step 1: Turn a vague report into a specific problem
“The server is slow” could mean a dozen things. Before you run a single command, ask:
- What exactly is slow: logging in, loading a web page, running a script, a database query, file transfers?
- When did it start? Was it sudden or gradual?
- Is it slow all the time or only at certain times?
- Did anything change recently, like an update, a deployment, a config change, or a jump in usage?
In an interview, asking these questions out loud is a strength. It shows you don’t guess.
Step 2: Find the scope
- One user or everyone?
- One application or the whole server?
- One server or several?
If only one application is slow, you’ll want that application’s service and logs sooner. If everything is slow, you’ll check overall resources first.
Also, consider whether the server is the problem at all. If you can log in and commands run quickly, but a web page loads slowly for users, the delay might be in the application, the database, DNS, or the network. (More on that near the end.)
Step 3: Check load average
nproc
uptime prints three load averages: the last 1, 5, and 15 minutes. nproc tells you how many CPU cores the machine has.
As a rule of thumb, a load average well above the core count suggests more work is queued than the machine can handle. A load of 8 on a 2-core server is a very different story from a load of 8 on a 32-core one.
Two useful habits:
- Compare the three numbers. If the 1-minute number is much higher than the 15-minute number, the problem is recent and getting worse. If the 15-minute number is high and the 1-minute is lower, it may be recovering.
- Remember what load includes on Linux. Linux load averages count processes that are runnable and also processes in uninterruptible sleep, which is usually waiting on disk I/O. That means a high load doesn’t automatically mean a busy CPU. Brendan Gregg’s write-up on this is worth reading if you want the history.
Step 4: Check CPU
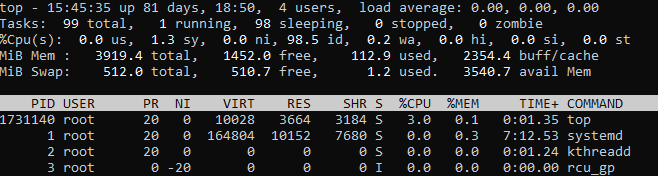
Look at the CPU line near the top. The fields that matter most:
What to take from it:
- High us or sy with low id: the CPU is genuinely busy. Find out what’s using it.
- High wa: the CPU is waiting on storage. The bottleneck is likely disk, not the CPU.
- High st on a virtual machine or cloud instance: the host is giving your VM less CPU time than it wants. That’s worth mentioning in a cloud support interview, because the fix isn’t inside the guest.
Handy keys inside top: press 1 to see each CPU core separately, P to sort by CPU, and M to sort by memory. htop shows the same information with a friendlier layout, if it’s installed.
Step 5: Check memory and swap
vmstat 1 5
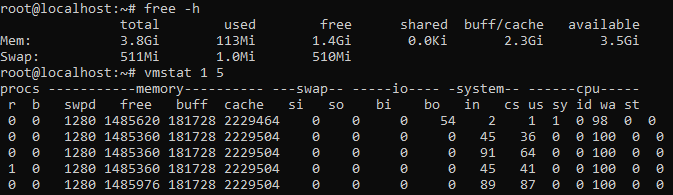
In free -h, look at the available column, not just “free.” Linux uses spare memory for caching, so a small “free” number is normal. “Available” is the system’s estimate of how much memory could be used for new applications without swapping.
Swap use by itself isn’t always a problem. Constant swapping is. In vmstat, the si and so columns show memory swapped in from disk and out to disk per second. If those numbers stay above zero while the system feels slow, memory pressure is a strong suspect.
If memory runs out completely, Linux may kill a process to recover. To check for that:
dmesg can be restricted to root on some systems, so you may need sudo. Also, the -T timestamps can be inaccurate after a suspend and resume, so treat them as approximate.
Step 6: Check disk space and inodes
An inode (short for “index node”) is a fundamental data structure in Linux and Unix-like filesystems that stores all the metadata about a file or directory, except for its name and the actual data content.
df -i
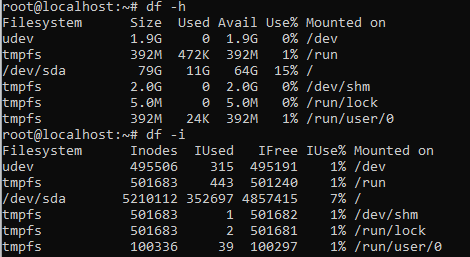
df -h shows how full each filesystem is. A filesystem at or near 100% can cause slowness and strange failures, because applications can’t write logs, temp files, or databases.
df -i shows inode usage. A filesystem can run out of inodes, which limits how many files it can hold, even when there’s free space.
To find what’s eating the space:
That lists the size of each directory directly under /var, staying on one filesystem, sorted from smallest to largest. Repeat inside the biggest directory to keep narrowing.
Step 7: Check disk I/O
If wa was high in top, or vmstat shows a lot of blocked processes in the b column, look closer at storage:
iostat -x 1 5


iostat comes from the sysstat package, which isn’t installed on every system. Look at the latency columns (await, or r_await and w_await on newer versions) to see how long requests are taking, and at utilization to see how busy the device is.
You can also look for processes stuck waiting on I/O. In ps, the state D means uninterruptible sleep, usually I/O:
A pile of processes in D state, plus high wa, points strongly toward storage.
Step 8: Find runaway or unexpected processes
ps aux –sort=-%mem | head
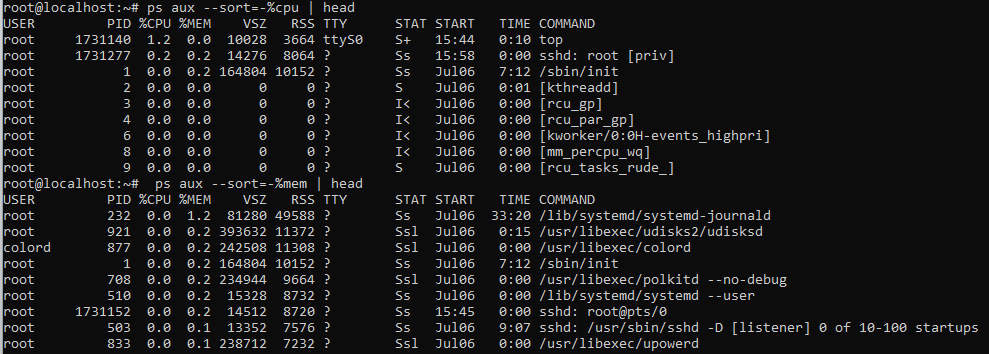
These list the biggest CPU and memory users. The important question isn’t just “what’s using resources?” It’s “is that expected?” A database using a lot of memory might be normal. A script that’s been pinning a core since yesterday probably isn’t.
In an interview, it’s a good sign to say that you’d confirm what a process is and who owns it before stopping it. Jumping straight to kill -9 on something you don’t understand can cause a bigger problem than the one you’re solving.
Step 9: Check services
systemctl –failed
systemctl status shows whether a service is running and includes its most recent log lines. systemctl –failed lists units that have failed. A service that’s repeatedly crashing and restarting can drag a system down without ever looking “down.”
Step 10: Read the logs
journalctl -p err -b
journalctl -u
- -u filters to one service.
- –since limits how far back you look.
- -p err shows messages at error priority or higher.
- -b limits output to the current boot.
Many applications also write their own log files, often under /var/log. Logs answer “what happened, and when?” so line them up with the time the problem started. That’s why Step 1 (when did it start?) matters so much.
When it might not be the server
If the server’s resources look healthy but users still report slowness, a few quick checks can help you decide whether to look elsewhere:
curl -o /dev/null -s -w ‘%{time_total}\n’ https://<
dig <
- ping gives a rough sense of latency and packet loss.
- The curl command prints how long a request took in total, which helps separate a slow application from a slow connection.
- dig shows the DNS query time. Slow name resolution can make everything feel slow.
You don’t need to go deep into networking for most entry-level Linux questions. Showing you know the problem might not be on the server at all is a good sign.
Weak answers versus stronger answers
None of these weak answers are foolish. Each has a good instinct inside it. The stronger versions just show more of the thinking.
“I’d run top.” Stronger: “I’d start by clarifying what’s slow and whether it affects the whole server or one application. Then I’d use top to check load, CPU, and memory, and look at disk with df.”
“I’d reboot it.” Stronger: “Rebooting might make the symptom go away, but it also removes evidence and causes downtime. I’d gather information first, and I’d only restart a service or the server if I had a reason and the right approval.”
“I’d check the logs.” Stronger: “I’d check logs too, but I’d want to know which ones and from when. I’d start with the affected service’s journal around the time the slowness began, then look at system-level errors.”
How to communicate your thinking in an interview
- Narrate the why. “I’m checking load first because it tells me whether the system is under pressure before I dig into any one thing.”
- Say what you’d expect to see. “If it’s disk I/O, I’d expect high wait time in top and processes stuck in D state.”
- Say what you’d do next in each case. Branching answers sound experienced.
- Be honest about syntax. “I don’t remember the exact iostat flags, but I’d check the man page or run it with –help.” Interviewers generally understand that people look things up.
- Finish with a summary. “So my working theory is X, I’d confirm it by Y, and my fix would be Z, with approval if this is production.”
Practice it hands-on
Reading is a start. Doing it is better. On a practice machine or virtual machine that you own, try these:
Drill 1: Create and find a CPU hog.
top
kill %1
Watch how the process shows up in top, then stop it. (Only do this on a machine you’re allowed to experiment on.)
Drill 2: Find what’s using disk space.
du -xh –max-depth=1 /var | sort -h
Drill 3: Read a service’s logs.
journalctl -u ssh –since “1 hour ago”
(The SSH service name varies by distribution, sometimes ssh and sometimes sshd.)
For each drill, say out loud what you’re checking and why. That’s the skill interviewers are usually trying to see.
Frequently asked questions
What’s the first thing to check when a Linux server is slow? Clarify what “slow” means and how widespread it is, then check load, CPU, memory, and disk. The exact first command matters less than showing you have a plan.
Is answering “top” enough in a Linux interview? It’s a reasonable starting point but usually an incomplete answer. Adding what you’d clarify first and how you’d narrow things down shows more of your reasoning.
What does high load average mean if CPU usage is low? On Linux, load includes processes waiting on disk I/O. High load with a mostly idle CPU often points toward storage, so check I/O wait and processes in uninterruptible sleep.
Is swap usage always bad? No. Some swap use is normal. Constant swapping while the system is slow is the warning sign.
Want more practice?
If you’d like structured practice with questions and troubleshooting scenarios like this one, I put together the SecureByDefault Linux Support Interview Prep Pack. It’s $19 and includes:
- 42 Linux interview questions with explanations
- 12 realistic troubleshooting scenarios
- Linux permissions and command reference material
- Rapid-review sections
- A structured 7-day interview prep plan
- Mock interview practice
- A final interview-day checklist
It’s built for people preparing for:
- Linux support roles
- Technical support roles
- Junior system administrator roles
- Cloud support roles
- Entry-level infrastructure roles
It can’t tell you what any specific interviewer will ask, and it won’t guarantee an outcome. It’s practice, organized.
You can also try free sample questions with answers first.
See the Linux Support Interview Prep Pack